File list
This special page shows all uploaded files.
| Date | Name | Thumbnail | Size | User | Description | Versions |
|---|---|---|---|---|---|---|
| 18:24, 27 November 2019 | Quantitative-99 1.jpg (file) |  |
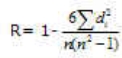
7 KB | Schmidc90 | Formel zur Berechnung der Rangkorrelation R | 1 |
| 18:24, 27 November 2019 | Quantitative-98 3.jpg (file) |  |
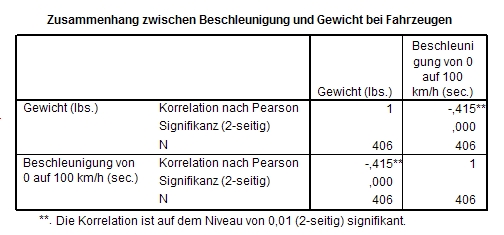
75 KB | Schmidc90 | Mit SPSS berechnte Maßkorrelation | 1 |
| 18:23, 27 November 2019 | Quantitative-98 2.jpg (file) |  |
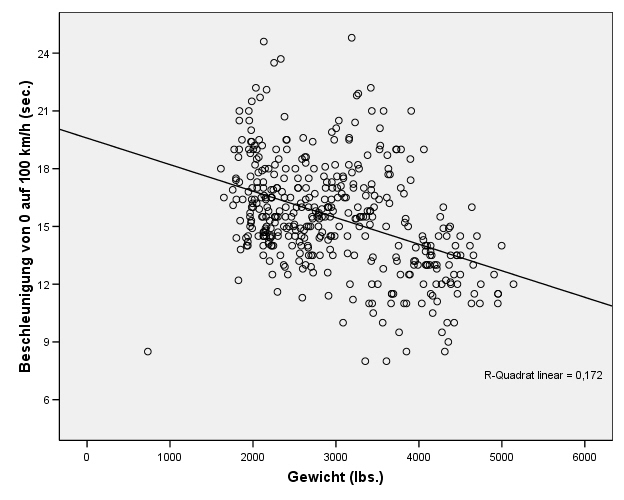
91 KB | Schmidc90 | Kontrolle der zweiten Bedingung (Linearer Zusammenhang) | 1 |
| 18:22, 27 November 2019 | Quantitative-98 1.jpg (file) |  |
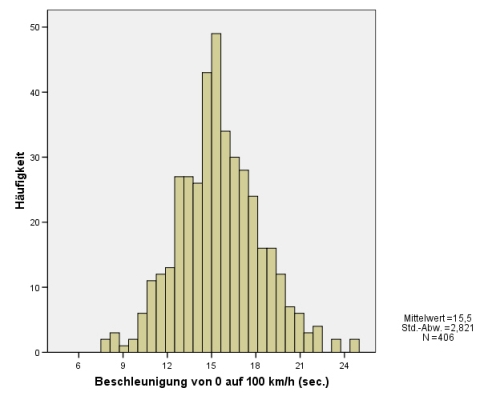
38 KB | Schmidc90 | Kontrolle der ersten Bedingung (Normalverteilung) | 1 |
| 18:22, 27 November 2019 | Quantitative-97 1.jpg (file) |  |
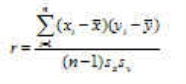
10 KB | Schmidc90 | Formel zur Berechnung der Maßkorrelation | 1 |
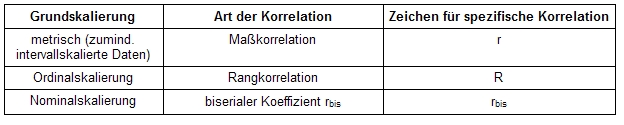
| 18:22, 27 November 2019 | Quantitative-96 1.jpg (file) | 56 KB | Schmidc90 | Geeigneter Korrelationskoeffizient für unterschiedliche Skalenniveaus | 1 | |
| 18:21, 27 November 2019 | Quantitative-95 1.jpg (file) |  |
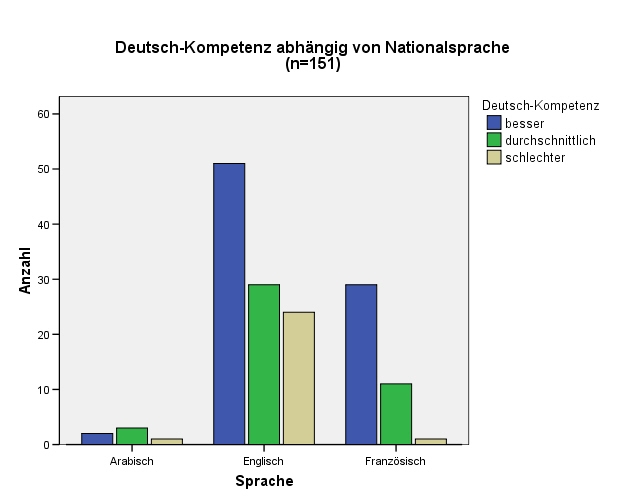
53 KB | Schmidc90 | Gruppiertes Balkendiagramm | 1 |
| 18:21, 27 November 2019 | Quantitative-94 1.gif (file) |  |
4 KB | Schmidc90 | Chi-Quadrat-Test | 1 |
| 18:21, 27 November 2019 | Quantitative-93 2.gif (file) |  |
6 KB | Schmidc90 | Kreuztabelle mit Zeilenprozentwerten zum Zusammenhang Muttersprache - Deutschkenntnisse | 1 |
| 18:20, 27 November 2019 | Quantitative-92 1.gif (file) |  |
3 KB | Schmidc90 | Kreuztabelle Deutschkenntnisse und Muttersprache | 1 |
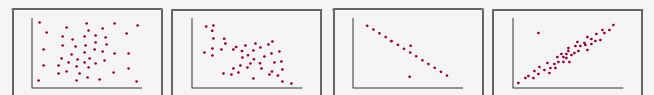
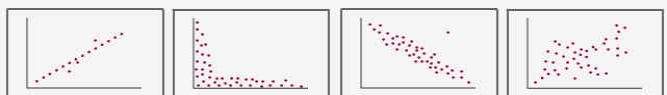
| 18:20, 27 November 2019 | Quantitative-91 4.jpg (file) | 22 KB | Schmidc90 | Mehrere Streudiagramme (2) | 1 | |
| 18:20, 27 November 2019 | Quantitative-91 3.jpg (file) | 23 KB | Schmidc90 | Mehrere Streudiagramme (1) | 1 | |
| 18:19, 27 November 2019 | Quantitative-91 2.jpg (file) |  |
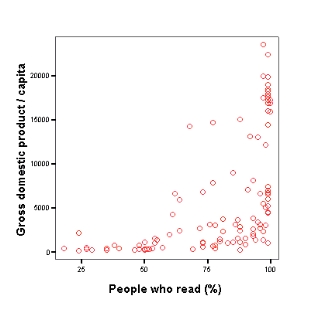
30 KB | Schmidc90 | Streudiagramm Zusammenhang zwischen Alphabetisierungsrate und BNP | 1 |
| 18:19, 27 November 2019 | Quantitative-91 1.gif (file) |  |
4 KB | Schmidc90 | Streudiagramm Zusammenhang zwischen weiblicher Bildung und Kindersterblichkeit | 1 |
| 18:17, 27 November 2019 | Quantitative-89 1.jpg (file) |  |
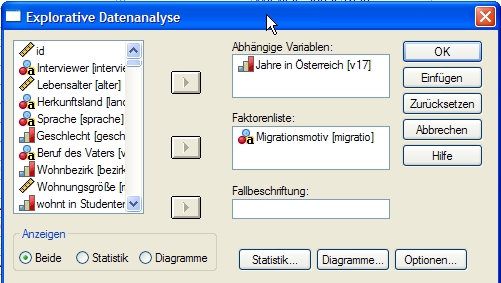
106 KB | Schmidc90 | Erstellung von Boxplots mit SPSS | 1 |
| 18:17, 27 November 2019 | Quantitative-88 1.jpg (file) |  |
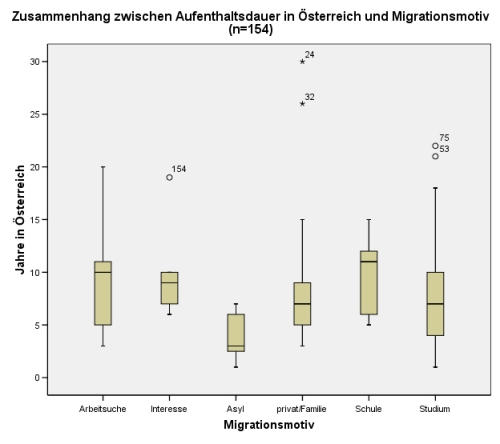
45 KB | Schmidc90 | Beispiel Boxplots | 1 |
| 18:16, 27 November 2019 | Quantitative-87 2.gif (file) |  |
6 KB | Schmidc90 | mit SPSS berechnete Streuungsmaße | 1 |
| 18:15, 27 November 2019 | Quantitative-87 1.jpg (file) |  |
84 KB | Schmidc90 | Berechnung von Streuungsmaßen mit SPSS | 1 |
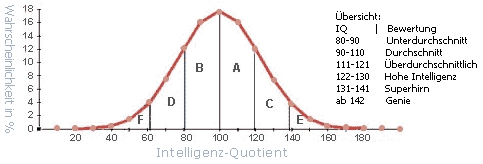
| 18:15, 27 November 2019 | Quantitative-83 2.jpg (file) |  |
47 KB | Schmidc90 | Intelligenzquotient | 1 |
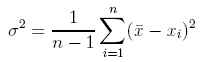
| 18:14, 27 November 2019 | Quantitative-82 1.jpg (file) |  |
5 KB | Schmidc90 | Formel zu Bereichnung der Varianz | 1 |
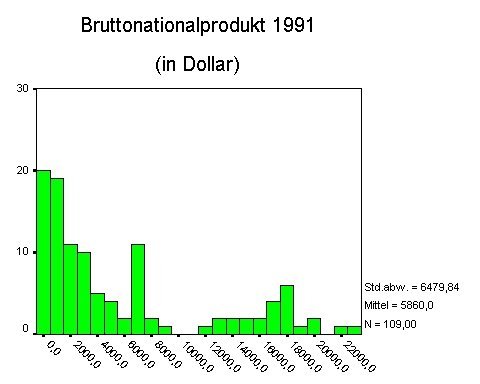
| 18:13, 27 November 2019 | Quantitative-81 1.jpg (file) |  |
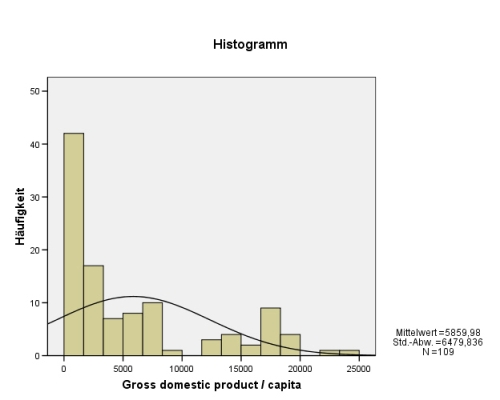
50 KB | Schmidc90 | Histogramm Bruttonationalprodukt 1991 | 1 |
| 18:12, 27 November 2019 | Quantitative-80 3.jpg (file) |  |
35 KB | Schmidc90 | Histogramm des BNE aller Länder der Welt | 1 |
| 18:12, 27 November 2019 | Quantitative-80 2.gif (file) |  |
3 KB | Schmidc90 | Lagemaße des BNE aller Länder der Welt | 1 |
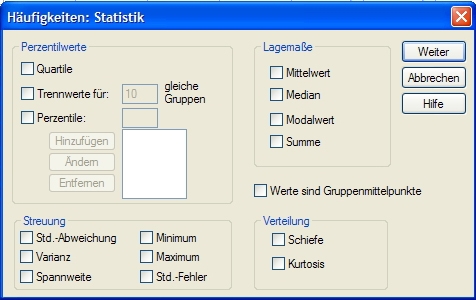
| 18:11, 27 November 2019 | Quantitative-80 1.jpg (file) |  |
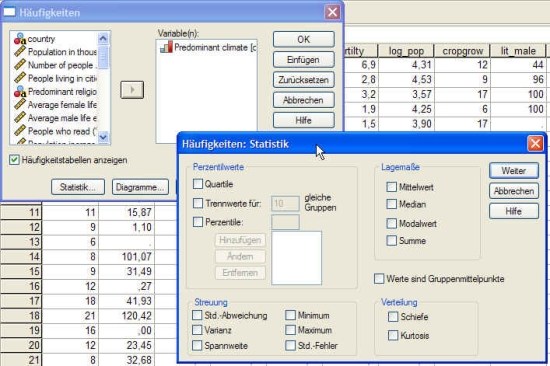
150 KB | Schmidc90 | Berechnung von Lagemaßen mit SPSS | 1 |
| 18:11, 27 November 2019 | Quantitative-79 1.jpg (file) |  |
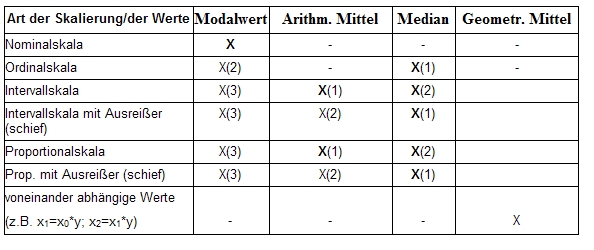
93 KB | Schmidc90 | Geeignetes Lagemaß bei verschiedenen Skalen | 1 |
| 18:11, 27 November 2019 | Quantitative-78 1.jpg (file) |  |
61 KB | Schmidc90 | Berechnung des harmonischen Mittels mit SPSS | 1 |
| 18:10, 27 November 2019 | Quantitative-77 1.jpg (file) |  |
4 KB | Schmidc90 | Formel für die Berechnung des harmonischen Mittels | 1 |
| 18:10, 27 November 2019 | Quantitative-75 3.jpg (file) |  |
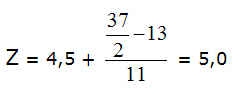
8 KB | Schmidc90 | Berechnung des Medians für das Beispiel "Zeitverbrauch" | 1 |
| 18:09, 27 November 2019 | Quantitative-75 2.jpg (file) |  |
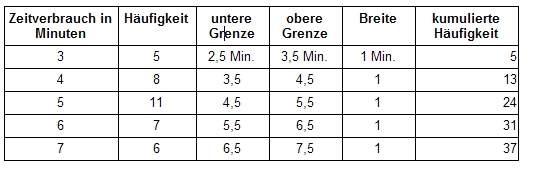
55 KB | Schmidc90 | Beispiel - Tabelle für den Zeitverbrauch bei der Lösung einer Aufgabe | 1 |
| 18:09, 27 November 2019 | Quantitative-75 1.jpg (file) |  |
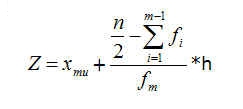
10 KB | Schmidc90 | Formel für den Median bei gruppierten Daten | 1 |
| 18:09, 27 November 2019 | Quantitative-74 2.jpg (file) |  |
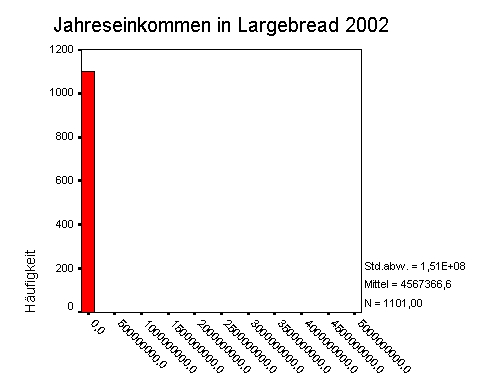
49 KB | Schmidc90 | Durchschnittseinkommen von Largebread mit Bill Gates | 1 |
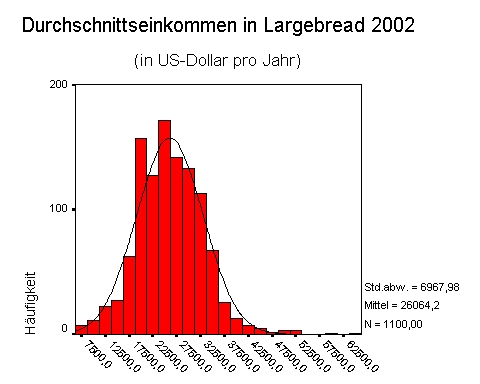
| 18:08, 27 November 2019 | Quantitative-74 1.jpg (file) |  |
64 KB | Schmidc90 | Durchschnittseinkommen in Largebread | 1 |
| 18:08, 27 November 2019 | Quantitative-73 3.jpg (file) |  |
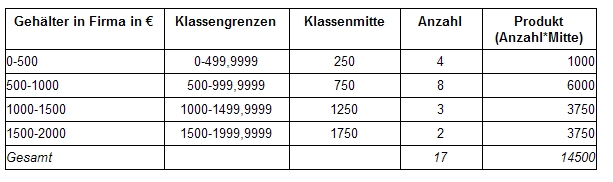
69 KB | Schmidc90 | Beispiel für die Klassenmitte von Messwertklassen | 1 |
| 18:07, 27 November 2019 | Quantitative-73 2.jpg (file) | 10 KB | Schmidc90 | Arithmetisches Mittel bei Einteilung der Messwerte in Klassen | 1 | |
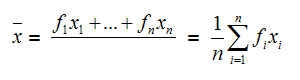
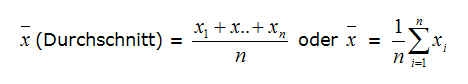
| 18:07, 27 November 2019 | Quantitative-73 1.jpg (file) | 15 KB | Schmidc90 | Formel für das arithmetische Mittel | 1 | |
| 18:06, 27 November 2019 | Quantitative-71 1.jpg (file) |  |
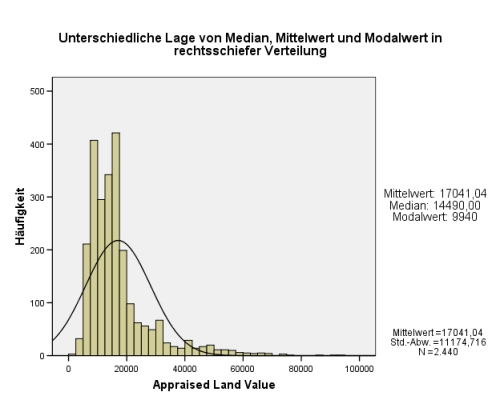
50 KB | Schmidc90 | Unterschiedliche Lage von Median, Mittelwert und Modalwert in rechtsschiefer Verteilung | 1 |
| 18:03, 27 November 2019 | Quantitative-70 3.jpg (file) |  |
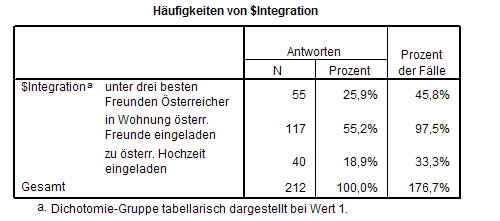
59 KB | Schmidc90 | Häufigkeitstabelle eines Mehrfachantwortensets | 1 |
| 18:03, 27 November 2019 | Quantitative-70 2.jpg (file) |  |
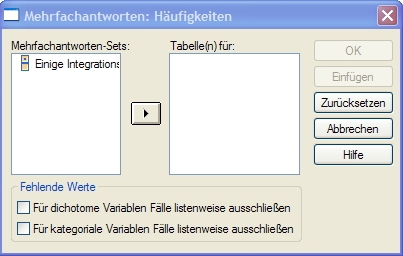
60 KB | Schmidc90 | Häufigkeitsanalyse von Mehrfachantwortensets mit SPSS | 1 |
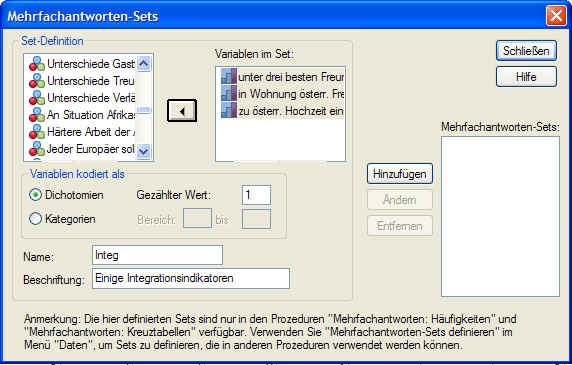
| 18:02, 27 November 2019 | Quantitative-70 1.jpg (file) |  |
121 KB | Schmidc90 | Definieren eines Mehrfachantwortensets mit SPSS | 1 |
| 18:02, 27 November 2019 | Quantitative-69 5.gif (file) |  |
2 KB | Schmidc90 | Häufigkeitstabelle mit Klassenlabels | 1 |
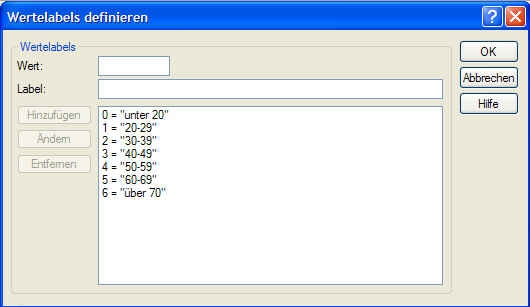
| 18:02, 27 November 2019 | Quantitative-69 4.jpg (file) |  |
50 KB | Schmidc90 | Wertelabels definieren mit SPSS | 1 |
| 18:01, 27 November 2019 | Quantitative-69 3.gif (file) |  |
2 KB | Schmidc90 | Häufigkeitstabelle der umkodierten Altersverteilung | 1 |
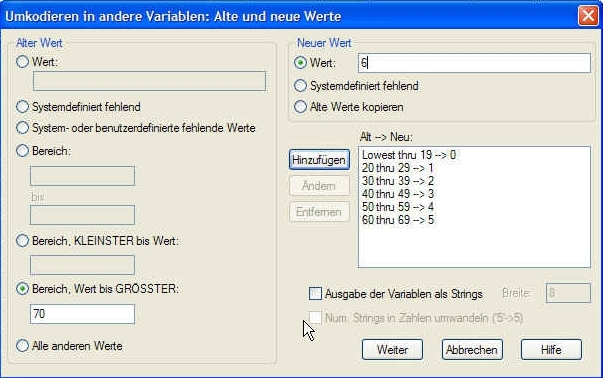
| 18:01, 27 November 2019 | Quantitative-69 2.jpg (file) |  |
142 KB | Schmidc90 | Umkodieren in andere Variablen mit SPSS | 1 |
| 18:01, 27 November 2019 | Quantitative-69 1.gif (file) |  |
6 KB | Schmidc90 | Häufigkeitsverteilung des Alters der Befragten | 1 |
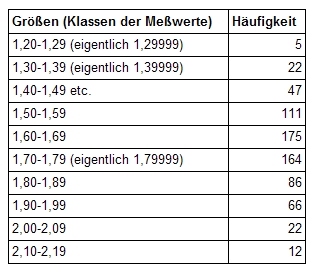
| 18:00, 27 November 2019 | Quantitative-68 2.jpg (file) |  |
63 KB | Schmidc90 | In Klassen eingeteilte Körpergrößen | 1 |
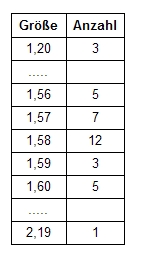
| 17:59, 27 November 2019 | Quantitative-68 1.jpg (file) |  |
24 KB | Schmidc90 | Gemessene Körpergrößen | 1 |
| 17:59, 27 November 2019 | Quantitative-66 1.gif (file) |  |
10 KB | Schmidc90 | Häufigkeitsberechnung mit SPSS - Beispiel Wohnbezirk | 1 |
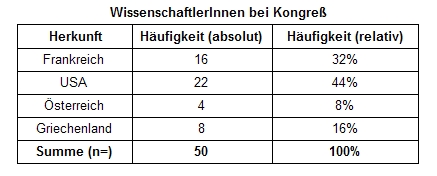
| 17:58, 27 November 2019 | Quantitative-65 1.jpg (file) |  |
50 KB | Schmidc90 | Häufigkeitstabelle - Herkunft der WissenschaftlerInnen eines Kongreß | 1 |
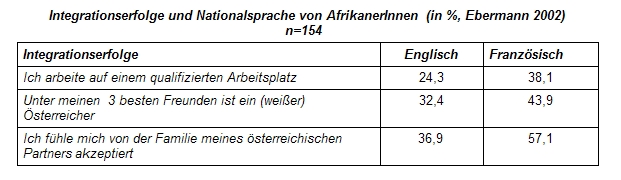
| 17:56, 27 November 2019 | Quantitative-65 3.jpg (file) |  |
79 KB | Schmidc90 | Mehrdimensionale Häufigkeitstabelle Integrationserfolge und Nationalsprache von AfrikanerInnen | 1 |
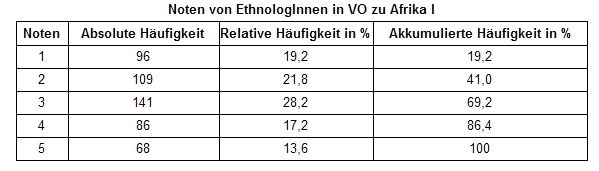
| 17:55, 27 November 2019 | Quantitative-65 2.jpg (file) |  |
60 KB | Schmidc90 | Häufigkeitstabelle - Noten von EthnologInnen | 1 |